

TEST SCORES AND LEARNING TRAJECTORIES
Having panel data, such as the LEAPS longitudinal follow-up, which contains carefully collected test scores, is incredibly rare in low-income settings. This kind of data allows our researchers to answer questions about how much learning really happens at schools, what is the impact of dropping out of school on learning, when do socio-economic test gaps develop, and to see how student learning progresses over time. These are fundamental questions that are impossible to answer without this type of rich data. This body of research is also closely related to current events, and one paper in particular studies the impact of exogenously interrupted studies on children’s educational outcomes.
Read the Summaries or Take a Deeper Dive

Test Scores and Educational Opportunities
Image: Evidence for Policy Design
Data from five long-running panel studies in Ethiopia, India, Pakistan, Peru, and Vietnam have fascinating insights for learning and education trajectories for students in low-income countries.
-
How does academic performance in primary school relate to future years of schooling attainment and college attendance in low- and middle income countries?
How does this association differ by socioeconomic status (SES)?
When do SES test score gaps emerge?
-
Using data from long-running panel studies in multiple countries, we show that children with higher test scores at age 12 report more years of schooling and higher college attendance by age 22 in every country.
In every country, children from low SES backgrounds who are in the 80th percentile of test scores at age 12 have similar years of completed schooling at age 22 as children from high SES backgrounds who were at the 20th percentile of test scores.
In all five countries, there are substantial SES gaps in test scores by age 8, but the absolute magnitude of the SES gap does not change appreciably between the ages of 8 and 15.
Learning Trajectories in a Low-Income Country
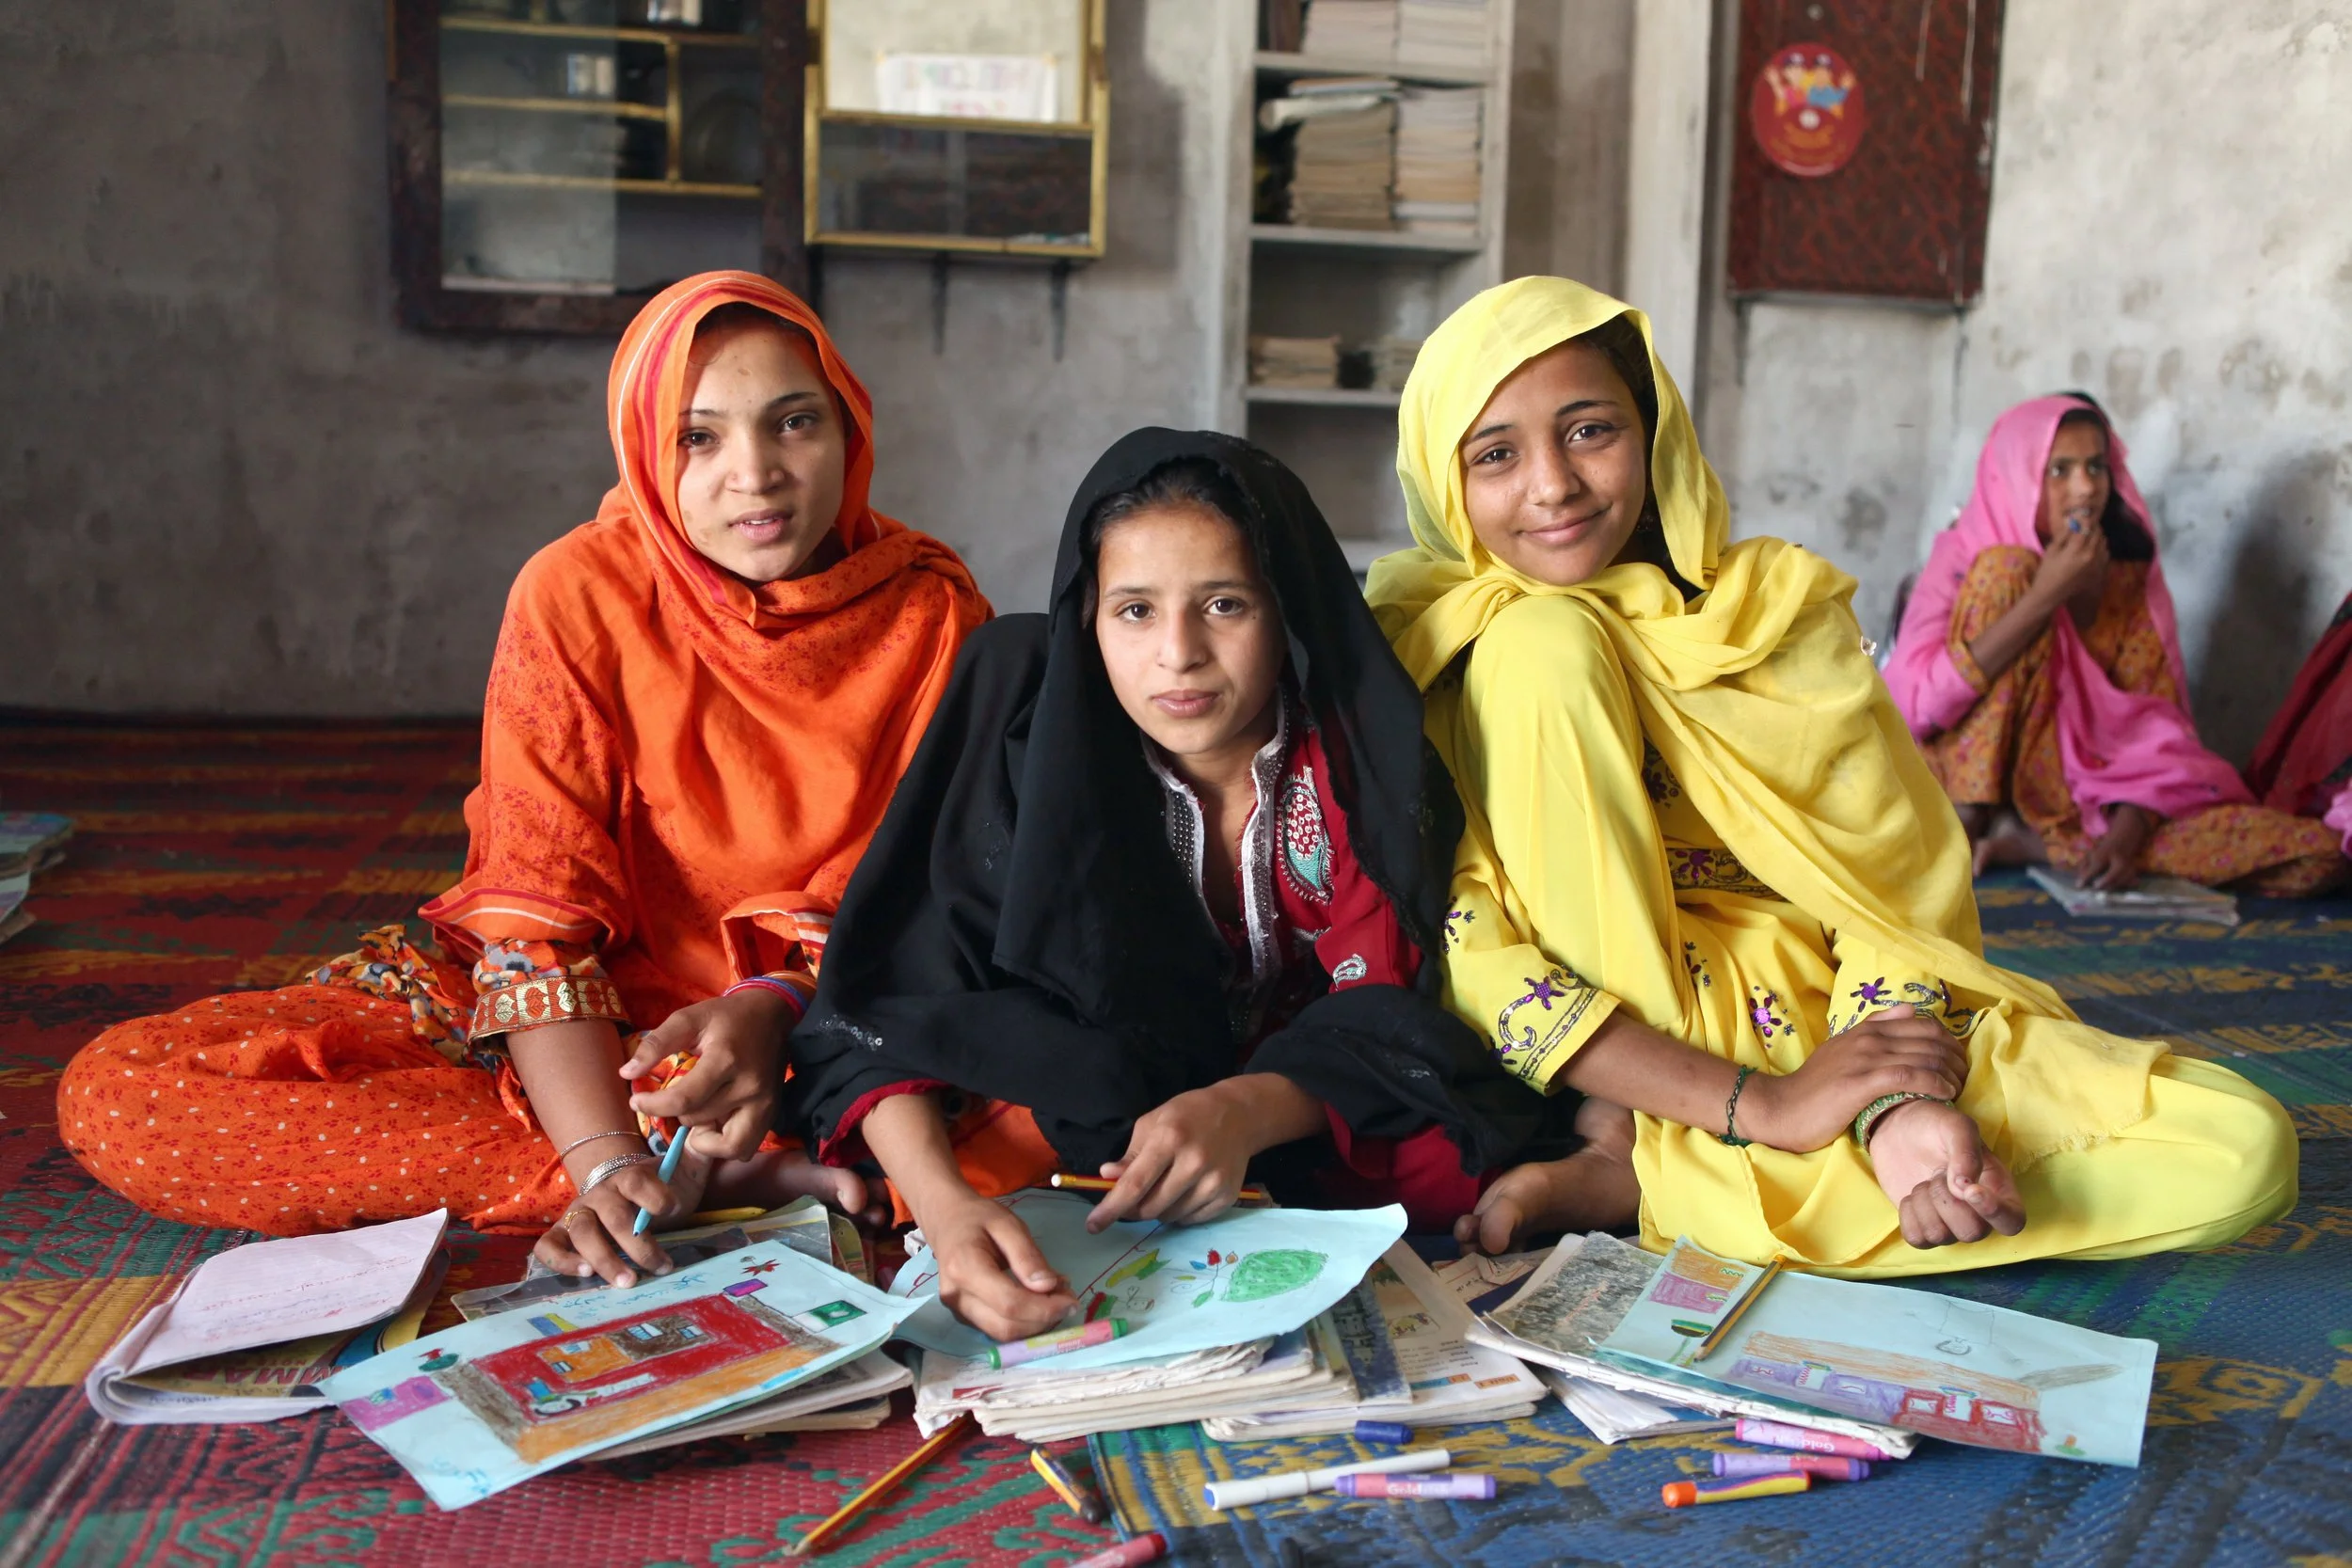
Image: Irina Werning, Oxfam
Using years of learning data from Pakistan this study explores what learning looks like from grades 3 to 6 and proposes a new term for the surprising patterns in the data: fragile learning.
-
Do children actually learn something during elementary school in Pakistan? How much?
Is this learning due to schooling as opposed to natural gains as children age?
Are low learning rates driven by less-prepared children (i.e. with initial lower test scores) falling further and further behind?
What are the patterns of learning for children in Pakistan over time?
-
Children do learn in every grade between grades 3-6 as measured by improvements in subject knowledge over time.
For children who drop out of school, learning gains between grades 3 and 5 were identical to children who did not drop out.
Children whose test scores were in the bottom 20% in grade 3 learned significantly more between grades 3 and 6 than children ranked in the top 20%.
We propose a new term for the patterns in the data: ‘fragile learning.’ Children learn in one year but are about as likely to forget as to consolidate their learning.

Human Capital and Disasters
Image: Foreign, Commonwealth & Development Office
Evaluating the impact of the 2005 earthquake in Pakistan shows that interruptions to child accumulation of human capital can be severe. Interruptions in schooling led to serious consequences for students years later. These findings are particularly relevant in the context of COVID-19 school closures.
-
What are the long-term impacts on children of being exposed to disasters during formative years?
How do the long-term impacts differ for various segments of society?
What are the potential implications of these findings for disruptions caused by the COVID-19 pandemic?
-
There are serious negative impacts of interruptions to a child’s schooling. This is the case even when households receive compensation to tide them over in difficult times and there is a seemingly full recovery for adults and infrastructure.
Data suggests that students between the ages of 3 and 15 at the time of the earthquake could have 1.5 years less schooling and earn 15% less every year of their adult lives.
Children in-utero or under the age of three at the time of the earthquake living closer to the fault line were shorter than those who lived further away.
The earthquake widened inequalities: children of mothers with some education were fully insulated from learning losses, whereas children of uneducated mothers suffered declines in learning.

Do Value Added Measures Add Value?
Image: Irina Werning, Oxfam
Value-added estimation has gained popularity for estimating education production functions when randomized studies are unavailable. Using rich panel data, this paper addresses three key empirical challenges: imperfect persistence, unobserved heterogeneity, and measurement error.
-
How much of a child’s achievement persists between grades?
How biased are the results from models of student learning that use incorrect assumptions on learning persistence?
Do private schools increase average achievement relative to public schools?
-
Learning persistence is low, with only one-fifth to one-half of achievement persisting between grades.
OLS estimates of learning persistence are contaminated both by measurement error in test scores and unobserved student-level heterogeneity in learning.
The impact of private schools is highly sensitive to the persistence parameter, and the dynamic panel estimates suggest large and significant contributions ranging from 0.19 to 0.32 standard deviations a year.